Introduction
In today’s fast-paced business environment, organizations are generating massive amounts of data every day. This data holds valuable insights that can drive better decision-making and lead to improved business outcomes. At Pathways Technologies, we understand the crucial role data visualization plays in helping organizations make sense of this data and make better, informed business decisions. In this blog, we will discuss the importance of data visualization in decision-making and how it can help organizations stay ahead in the competitive landscape.
What is Data Visualization?
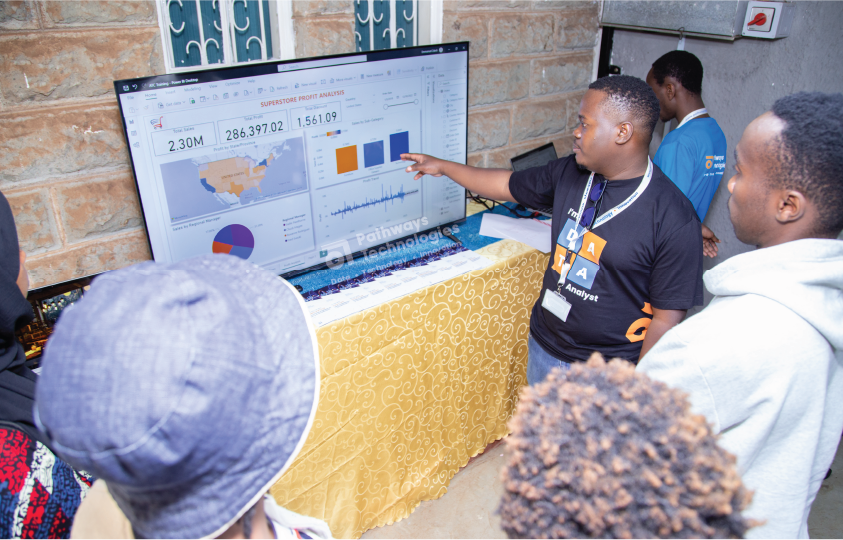
Data visualization is the process of representing data in a graphical or pictorial format, such as charts, graphs, and maps. It helps decision-makers see patterns, trends, and correlations that might go unnoticed in traditional text-based data presentation. By presenting data visually, it becomes easier for stakeholders to understand complex datasets, identify new opportunities, and make data-driven decisions.

Why is Data Visualization Important in Decision-Making?
1. Faster Decision-Making
Data visualization enables decision-makers to grasp complex information quickly, allowing them to make informed decisions in a timely manner. With the ability to analyze large datasets visually, organizations can identify trends and patterns faster, leading to quicker decision-making and better business outcomes.
2. Improved Comprehension
Data visualization makes it easier for decision-makers to understand complex datasets by presenting the information in a more digestible format. This improved comprehension enables stakeholders to identify trends, correlations, and outliers that may not be apparent in traditional text-based data presentation.
3. Enhanced Collaboration
Data visualization facilitates collaboration among team members by providing a common language for discussing data. When data is presented visually, it is easier for team members across different departments to understand the information and contribute to the decision-making process.
4. Identification of Emerging Trends
Data visualization helps organizations identify emerging trends and patterns that may not be apparent in traditional data analysis. By visualizing data, decision-makers can spot new opportunities and potential threats, allowing them to make proactive decisions to stay ahead of the competition.
5. Effective Communication
Data visualization is an effective way to communicate complex information to stakeholders, both internally and externally. By presenting data visually, organizations can convey their message more effectively and persuasively, leading to better decision-making and improved business outcomes.
How Pathways Technologies Can Help
At Pathways Technologies, we are committed to helping organizations harness the power of data visualization to make better, informed business decisions. Our team of experts can help you design and implement data visualization solutions tailored to your organization’s unique needs, ensuring you have the tools you need to make data-driven decisions with confidence.
Conclusion
Data visualization is a powerful tool that can help organizations make better, informed business decisions. By presenting data in a visual format, decision-makers can quickly identify trends, patterns, and correlations, leading to faster and more effective decision-making. With the help of Pathways Technologies, your organization can leverage the power of data visualization to stay ahead in the competitive landscape and drive improved business outcomes.


